I got super behind on my blogging about my units during the year, so I am using this time during the summer to reflect and blog about my units... :o)
Unit 4a: Scatter Plots, Correlation and Line of Best Fit
This year I only had two weeks to spend on scatter plots, correlation and line of best fit. Last year was when I discovered how well the mini table worked when teaching the line of best fit. If you have been reading my blog, you know that this year I started teaching the mini table at the beginning of the year in my Linear Relationships Unit. My goal was to set them up for success in this unit and writing the equation for the line of best fit. :o)
Math 8 Lesson - Scatter Plots and Correlation
The first part of the concept was an introduction lesson to scatter plots and understanding correlation.
After giving the introduction guided notes (left-side), the first day was focused on reading and interpreting scatter plots and correlation. This was done in teams and included a lot of discussion and negotiating. :o)
The students did a round of Recorder/Reporter and the teams determined the correlation on a graph using basic math terms.
I taught the students how to replace x and y with the words in the situation. Then the students a round of Recorder/Reporter and the teams determined if there was a relationship between the data.
The students did a round of Recorder/Reporter and the teams determined and described the relationship in real world scenarios.
After practicing interpreting and describing correlation with their teams, students did my Socrative (self-paced) "Digital Task Cards" lesson on Scatter Plots and describing Correlation.
Here is my Socrative Code. Feel Free to Use. :o)
Scatter Plots and Correlation: SOC-19301623
Math 8 Lesson - Correlation and Trend Lines
The second part of the concept was an introduction to creating scatter plots, describing the correlation and using trend lines. After giving the guided notes (right-side), the focus was on creating scatter plots from a table of data, describing the correlation and then using the trend line to estimate and solve problems.
I made a Scatter Plot Dry Erase Mat for the students to use. (Feel free to use)
The students set the scatter plots up with me, and then the students did Recorder/Reporter in teams to answer questions based on the data on the
scatter plot.
iMath Lesson - Buzzmath and Scatter Plots
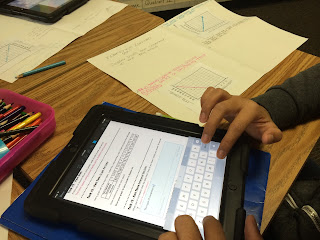
I introduced my students to the Buzzmath app. Students loved it because it was interactive. Buzzmath gives immediate feedback, generates new questions if they missed it, and students could annotate on the problems as well as interact with the problem.
iMath Lesson - Scatter Plots, Correlation and Trend Lines Poster Task
We finished this part of the unit on scatter plots, correlation and trend lines by doing a Showbie Poster Task.
Math 8 Lesson - Writing the Equation for Line of Best Fit
The next part of the concept was focused on drawing the line of best fit and writing the equation for the line of best fit using the mini table.
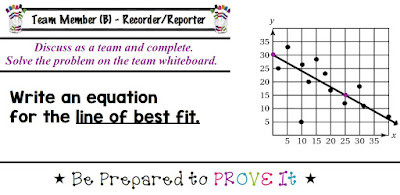
The focus was first on writing the equation for the line of best fit. Students did a round of Recorder/Reporter and practiced in teams.
iMath Lesson- Writing the Equation for the Line of Best Fit
Math 8 Lesson - Drawing the Line of Best Fit
Then we focused on estimating and drawing a line of best fit. Then writing the equation of the line of best fit using the mini table.
iMath Showbie Lesson - Drawing the Line of Best Fit
Using a protractor and stylus, students were able to practice drawing the line of best fit in my Showbie "paperless" review.
This was by far the easiest year for teaching the line of best fit. Students already knew how to use the mini table to write the equation of a line and did not struggle on this concept at all. :o) #minitablerocks
Socrative: Scatter Plots, Correlation and Line of Best Fit "Team Task"
We ended the unit with my Socrative Collaborative "Team Task" on Scatter Plots, Correlation and the Line of Best Fit, Space Race Style.
Here is my Socrative Code. Feel Free to Use. :o)
Scatter Plots and Line of Best Fit "Team Task": SOC-19482506
Math 8 - End of the Quarter Writing Assessment
Students did an end of the quarter creative writing assignment on scatter plots. This was the first time students did the writing assignment digitally. It really went well and I received some really creative stories from the students. :o)
Unit Reflection
This unit flowed and the students were able to make the connections throughout the entire unit. Teaching the students the mini table early in the year and giving them the background with the mini table and understanding how to interpret situations helped set the students up for success in this unit.Thanks for stopping by and checking out my blog. I hope you were inspired... :o) Feel free to leave feedback.


Hi. Where did you find the note sheets for the interactive notebook or did you create them yourself? Thanks!!
ReplyDeleteI really loved reading your post on this unit!! It inspired me as I begin my unit next week. I want to implement the socrative task cards (thanks for the link!! You rock!) Is there any way that I could get ahold of your guided notes pages you used for this unit? Keep being awesome, thanks again for the inspiration!
ReplyDeleteAWESOME Post!! I will be using several of your materials.
ReplyDelete